
One Chart: Approval Bottlenecks by Stage

Ask a project team where approvals get stuck and you'll get five confident, contradictory answers. Ask the data, and it usually tells a quieter story: the delay isn't spread evenly across the process. It clusters — and almost never where the loudest complaint points.
That matters because most process fixes target the wrong stage. Teams pour effort into speeding up intake or tidying the release step, while the real wait — the one adding weeks — sits somewhere no one measured. You can't fix a bottleneck you haven't located, and you can't locate it by feel. You locate it by putting a number on each stage.
The wait isn't the work
The first thing measurement reveals is that the delay is rarely the actual reviewing. The technical review takes an afternoon; the request then sits for a week on a desk waiting for that afternoon to happen. The stall lives in the gaps between stages — the queue time, the waiting-for-attention time — not in the effort itself. That's good news, because queue time is far easier to fix than the work itself.
Read the chart from the top down
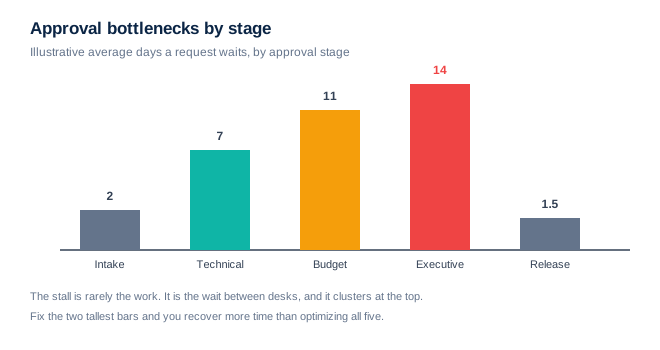
The illustrative pattern above is the one that shows up again and again. Intake and release are quick. The wait grows through technical and budget review, then peaks at executive sign-off — the tallest, reddest bar. It's a predictable shape: the higher up the chain a decision travels, the scarcer the approver's attention and the longer the request waits its turn. The bottleneck isn't a slow person; it's a busy one with a full queue.
That top-heavy shape has a clear implication. If you spread your improvement effort evenly across all five stages, you barely move the total. If you attack the two tallest bars — budget and executive — you recover more time than optimizing the other three combined. Effort should follow the height of the bar, not the volume of the complaint.
Three ways to shorten the tallest bars
Give the approver the whole file at once. Most executive delay is re-gathering context. A complete, ready-to-decide package removes the back-and-forth that stretches the wait.
Set a visible clock per stage. When everyone can see how long a request has waited at each desk, the queue stops being invisible — and invisible queues are the ones that grow.
Define who can decide without escalating. Every unnecessary trip to the top adds days. Push routine calls down to where they can be made quickly and safely.
Measure before you optimize
The lesson of this one chart is almost embarrassingly simple: measure the wait at each stage before you try to fix any of it. A week of timestamps will tell you more than a month of opinions, and it will almost certainly point you higher up the chain than your instinct did. Find the tallest bar first. Then, and only then, start improving.
The stall you can measure is the stall you can shorten. For more single-chart breakdowns of where projects lose time, see the XNM blog.